The Catastrophe of #pragma unroll in CUDA Programming
This post records a CUDA performance issue I previously overlooked, as a reminder to myself and to friends who might encounter similar situations in the future.
Recently, I’ve been optimizing the performance of the Linear kernel in the Mirage Persistent Kernel. In short, this kernel, as part of the overall persistent kernel, is responsible for performing matrix multiplication and residual addition using 128 threads in a single thread block on an Ampere machine. In the old version of the code, I swapped loop orders to reduce loading, checked for and reduced bank conflicts, cut down unnecessary shared memory usage, implemented a global pipeline, vectorized write-backs, added branch avoidance (this one is interesting enough for another write-up), and so on. After all these aggressive changes, I did see performance improvements in test scenarios. But then, when I tested on small baseline cases, I found performance dropped by 2×!
This result left me completely baffled. The matrix shape (8, 4096) × (4096, 64) is heavily used in our qwen3 demo, and a 2× slowdown is absolutely unacceptable. What was most confusing was that my optimizations should have had little effect in this smaller OUTPUT_SIZE (64) setting. In many respects, the new and old versions should have similar memory access and computation patterns, with the new version even having objective advantages like reduced resource usage and fewer bank conflicts. There was no reason it should be 2× slower.
Fortunately, thanks to previous experience, I was already somewhat familiar with NCU, so I quickly ran extensive comparisons to look for clues. Out of all the experiments, two related findings stood out:
-
If I quadrupled the computation per iteration, performance flipped from being 2× slower than the old version to actually being faster.
-
One particular metric skyrocketed in the new version: Stall No Instruction.
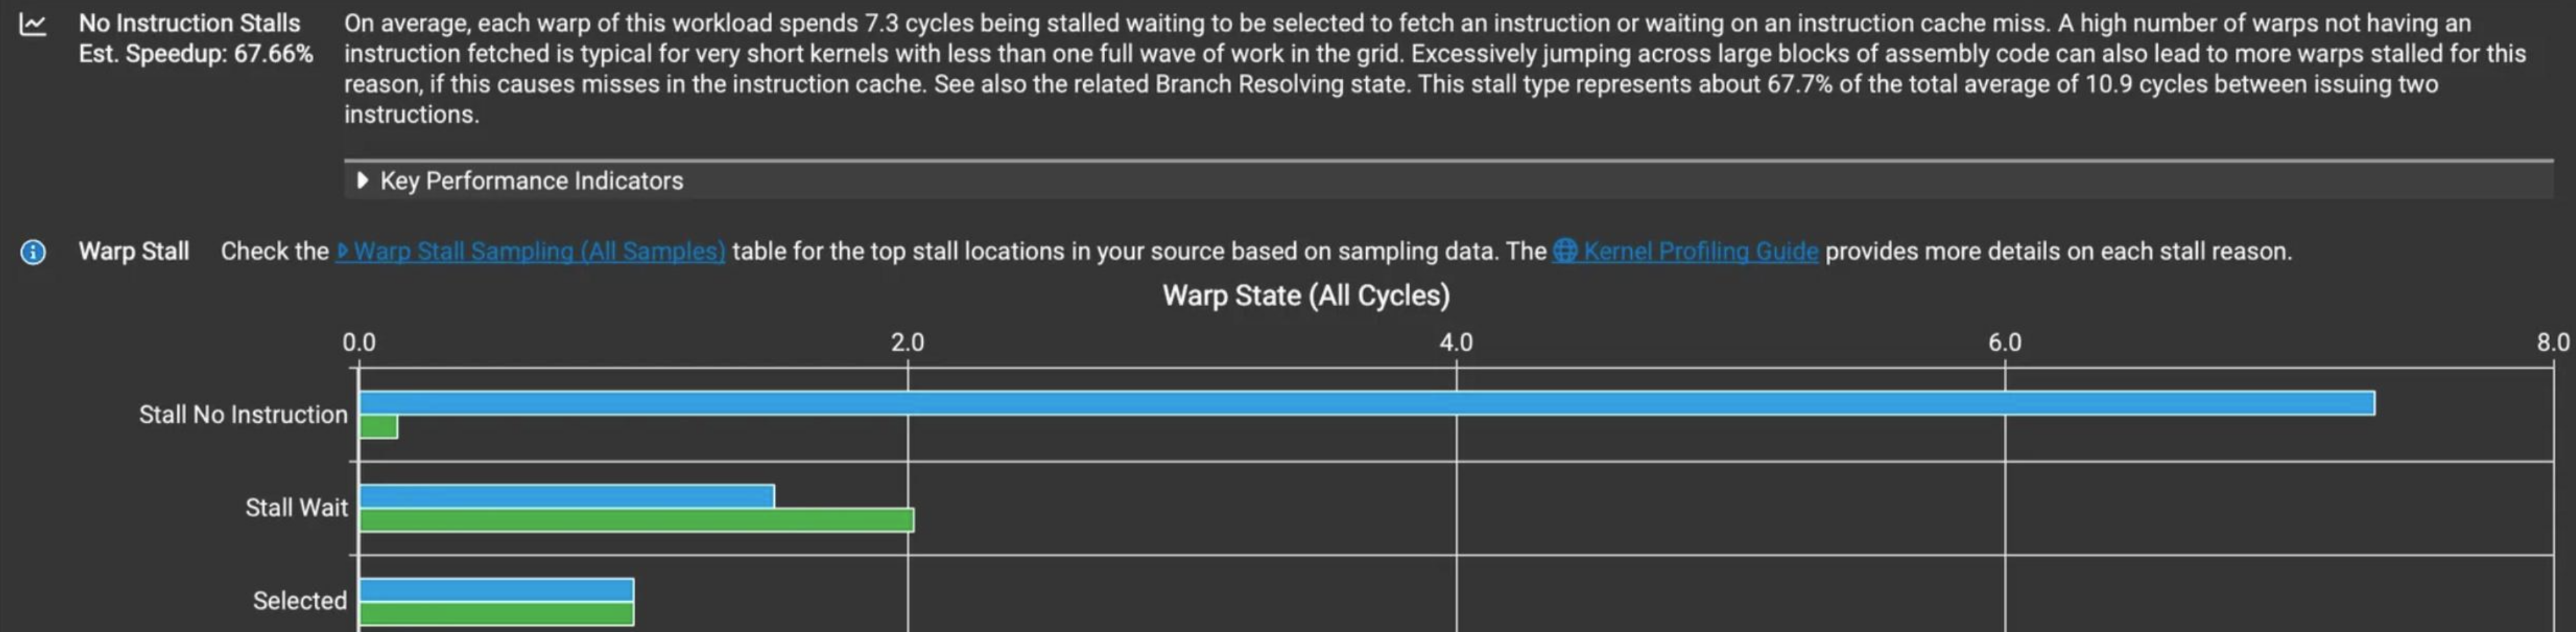 Figure 1: NCU profiling comparison showing the dramatic increase in “Stall No Instruction” metric between old and new kernel versions.
Compared to the green bar of the old version, the new version’s number was over 50× higher! Sure enough, I found an important clue in the official documentation during my search:
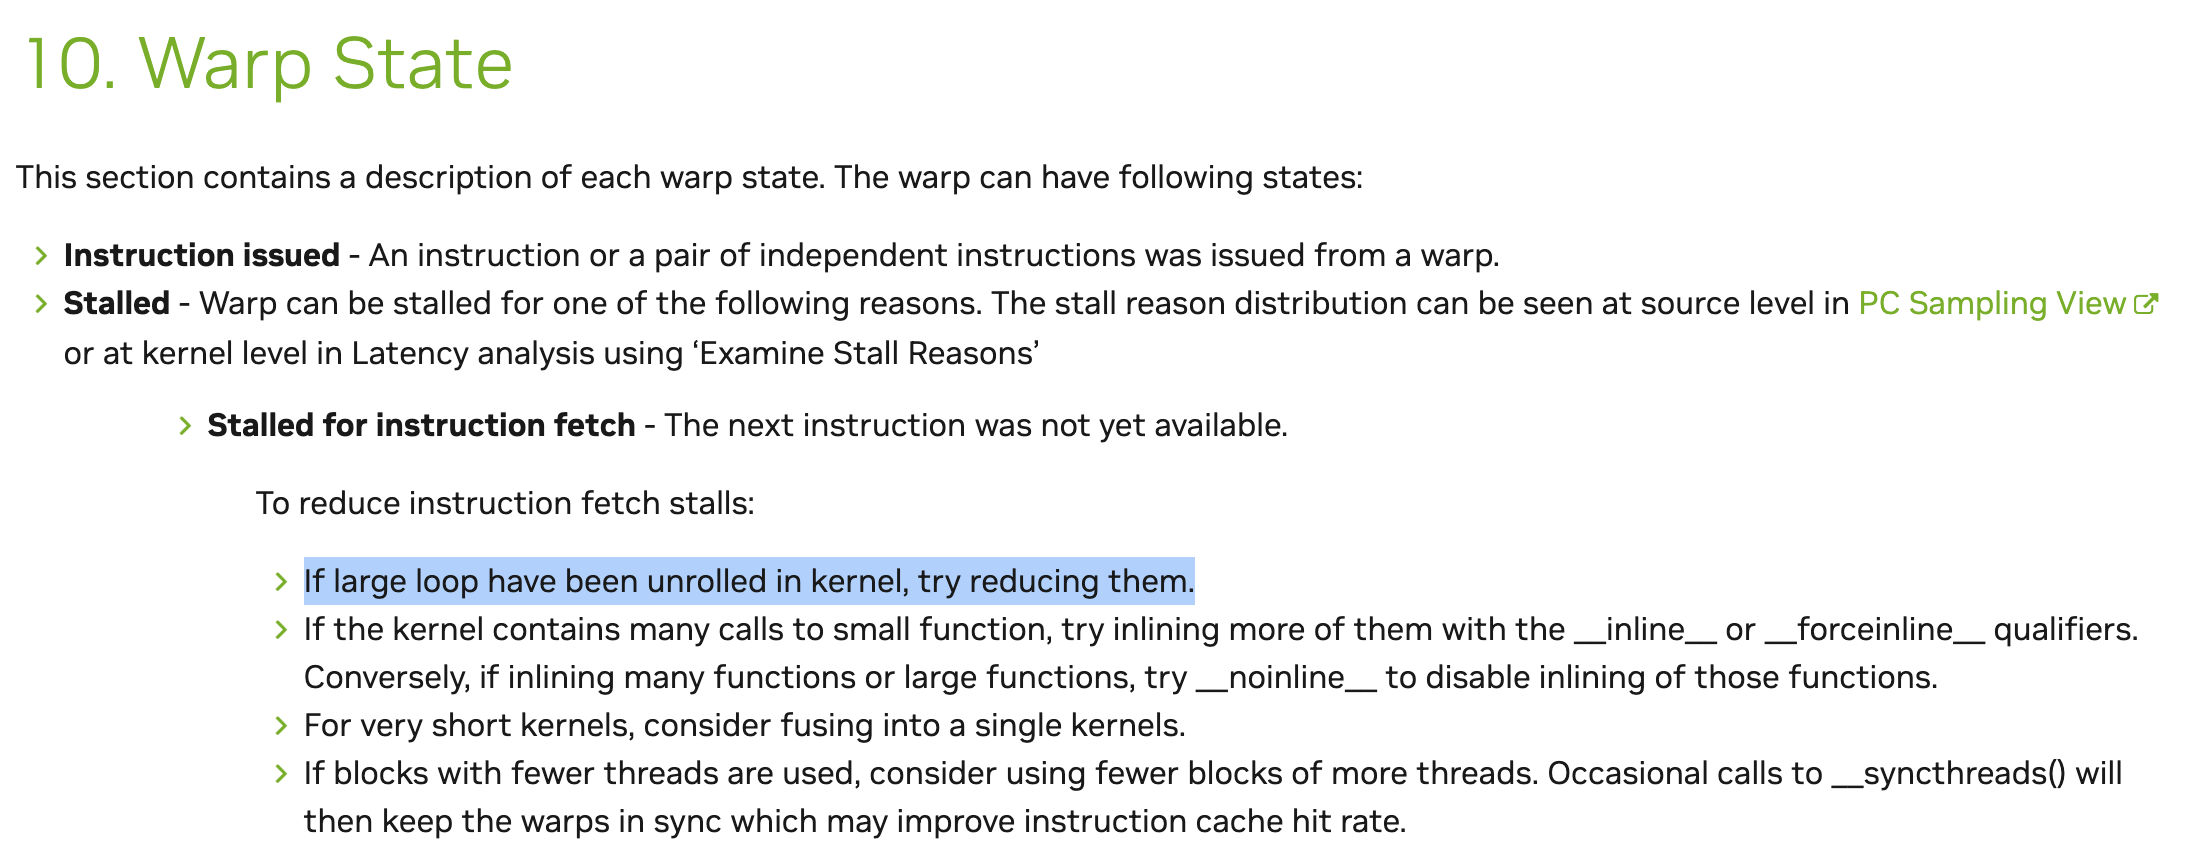
#pragma unroll — in our code, whenever a for loop had a range and step size known at compile time, we applied #pragma unroll. Let’s see what the official docs say about it:

In other words, we told the compiler to fully unroll every possible loop. This nearly eliminates all loop comparison and increment overhead, reduces branching, and gives the compiler more freedom to reorder instructions. But it also massively bloats the code size—so much so that the instruction cache cannot hold it. The warp can’t fetch instructions directly from the cache and instead has to take much longer fetch paths. In small compute workloads, the computation is too short to hide this instruction fetch overhead, leading to the surge of “stall no instruction.” To verify this, I dumped the SASS files to count instructions:
cuobjdump -sass [exec] > [output_name].sass
| Version | SASS instruction counts |
|---|---|
| Old version | 1.3k |
| New version | 12.9k |
Bingo! The new version’s compiled SASS instruction count was 10× higher than the old version. But wait—since both versions were always using full #pragma unroll, why wasn’t the old version just as inefficient?
Looking back at the code, I realized there had been a “happy accident”: in the old version, some loops only executed once, so the author hadn’t added #pragma unroll in those cases. That unintentionally kept the instruction count reasonable and gave the old code an edge in the new scenario. Ironically, this oversight is what drew my attention to the huge discrepancy. To test further, I added #pragma unroll to all loops in the old version and re-ran benchmarks. As expected, SASS instruction count and execution time all skyrocketed:
| Version | SASS instruction counts |
|---|---|
Old version + full #pragma unroll | 14k |
Given this, the improvement direction was clear: for small workloads, we must limit #pragma unroll expansion to strike a balance between redundant computation and instruction cache capacity. However, “balance” here is vague. Our understanding of instruction cache behavior is limited, and with a kernel containing more than a dozen loops, it’s nearly impossible to quantitatively decide the optimal unroll factors—once again proving that “the endgame of the universe is parameter tuning.” Qualitatively, we should fully unroll short, frequent loops, but keep unrolling limited for long, instruction-heavy ones. I’d love to hear more experiences and insights from others on this methodology.
In experiments, I confirmed that small kernels are indeed very sensitive to unrolling strategies. Eventually, I found a combination that performed reasonably well within the tested range, finally escaping the nightmare of abnormal performance. There are still other optimization opportunities in this kernel worth trying, but for now, here are the main takeaways:
-
Excessive
#pragma unrollcauses instruction bloat, exceeding the instruction cache capacity, leading to increased fetch latency and a surge in “stall no instruction.” -
For small workloads, compute time is too short to hide fetch delays, so the slowdown is especially dramatic (a full 2×).
Update – 2025.09.07
Today, I brute-forced all reasonably possible #pragma unroll N combinations for OUTPUT_SIZE=64 and uncovered some patterns specific to our code in this scenario. Roughly speaking: the outermost loop must be set to 2 (neither 0 nor higher—both slow down performance significantly); some parts of the code must either be fully unrolled or not unrolled at all (partial unroll makes things worse); some parts must remain unrolled; the rest can be fully unrolled. From the dizzying output table, we gained some insights, but at best this just gives us a new direction to try in future implementations. To truly maximize performance, we’ll still need to finetune the mix of unroll degrees across different loops.